Supply Curves & PED
Press for different diagrams
Price inelastic supply: PES < 1

-
When price increases (by 10%) from P1 to P2 -> higher profit incentivizes the producers to supply more by 5% from Q1 to Q2 -> but percentage change in quantity supplied < percentage change in price due to limited raw materials -> PES < 1 -> supply is price inelastic
Diagram Explanations:
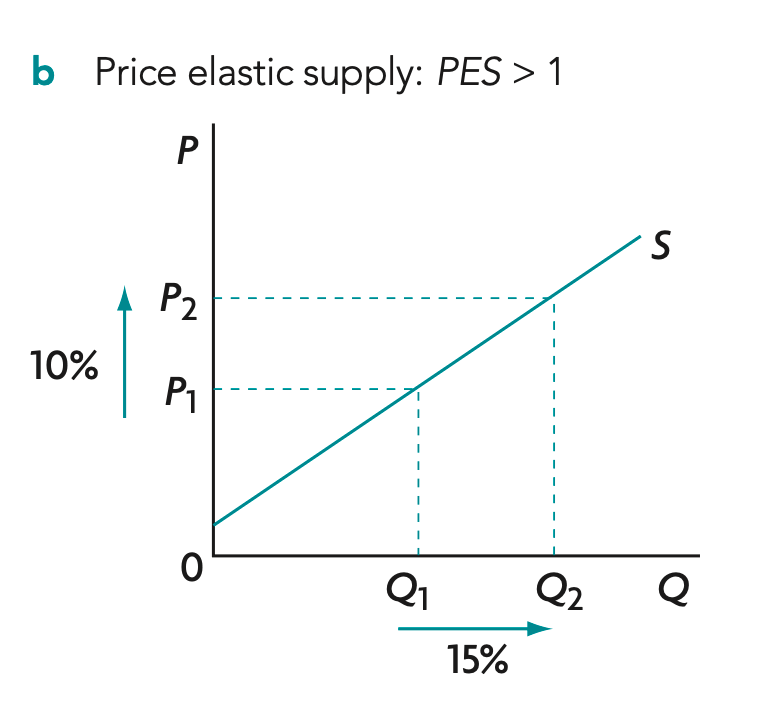
Price elastic supply: PES > 1
-
When price increases (by 10%) from P1 to P2 -> higher profit incentivizes the producers to supply more by 15% from Q1 to Q2 -> percentage change in quantity supplied > percentage change in price due to better tech/ newly found raw materials -> PES > 1 -> supply is price elastic
Diagram Explanations:
Unit elastic supply: PES = 1

Diagram Explanations:
-
Supply curve passes through the origin -> price and quantity supplied always change in the same proportion
-> percentage change in quantity supplied = percentage change in price -> PES = 1 -> supply is unit elastic
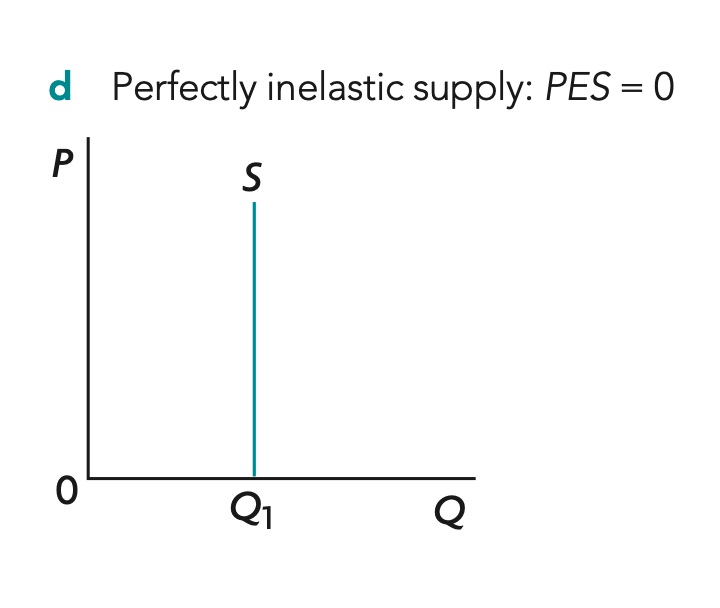
Perfectly inelastic supply: PES = 0
-
When price increases -> higher potential profit incentivizes producers to supply more -> however, quantity supplied cannot increase due to insufficient raw materials/other determinants -> quantity supplied remains at Q1 -> percentage change in quantity supplied = 0 -> PES = 0 -> supply is perfectly inelastic
Diagram Explanations:
Perfectly elastic supply: PES = ∞

-
Price is at P1 -> producers are willing to supply at any quantity demanded -> quantity supplied can increase without changing the price -> percentage change in quantity supplied is infinitely large -> PES = ∞ -> supply is perfectly elastic
Diagram Explanations: