Demand Curves & PED
Press for different diagrams

Price inelastic demand: 0 < PED <1
Diagram Explanations:
-
When price increases (by 10%) -> consumers still need the good/few substitutes > quantity demanded falls slightly (by 5%) -> percentage change of Qd < percentage change of price -> PED < 1 -> demand is inelastic
Price elastic demand: 1< PED < ∞
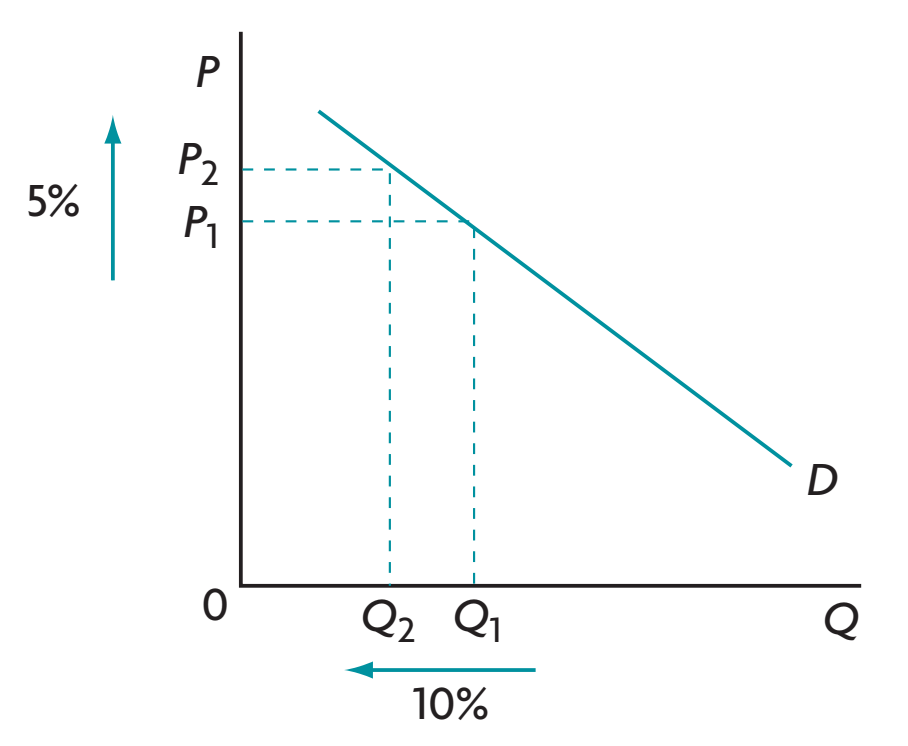
Diagram Explanations:
-
When price increases (by 5%) -> consumers switch to substitutes -> quantity demanded falls more (by 10%) -> percentage change of Qd > percentage change of price -> PED > 1 -> demand is elastic
Unit elastic demand: PED = 1
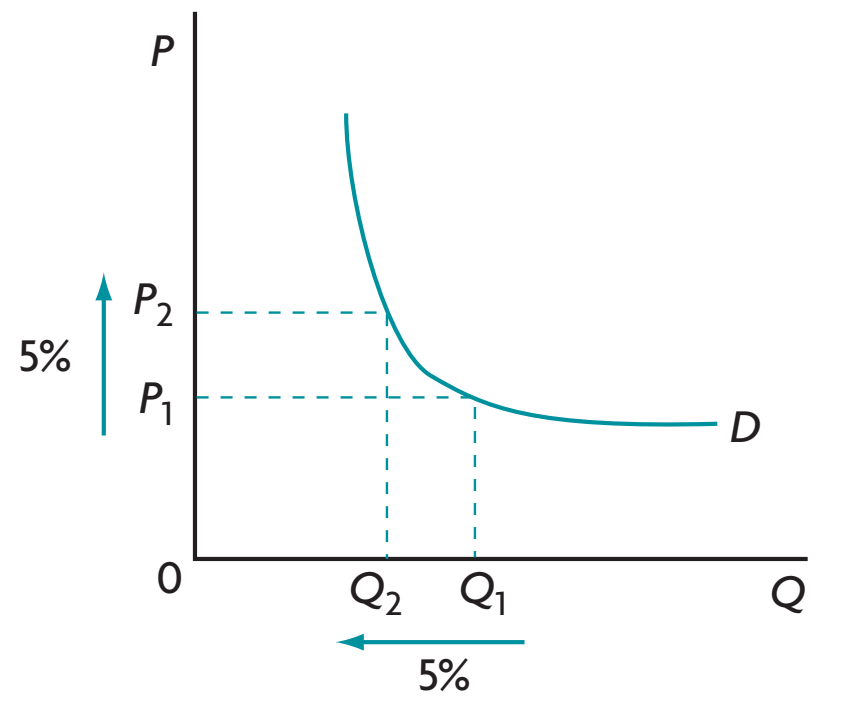
Diagram Explanations:
-
When price increases (by 5%) -> quantity demanded falls (by 5%) by the same percentage -> percentage change of Qd = percentage change of price -> PED = 1
Perfectly inelastic demand: PED = 0
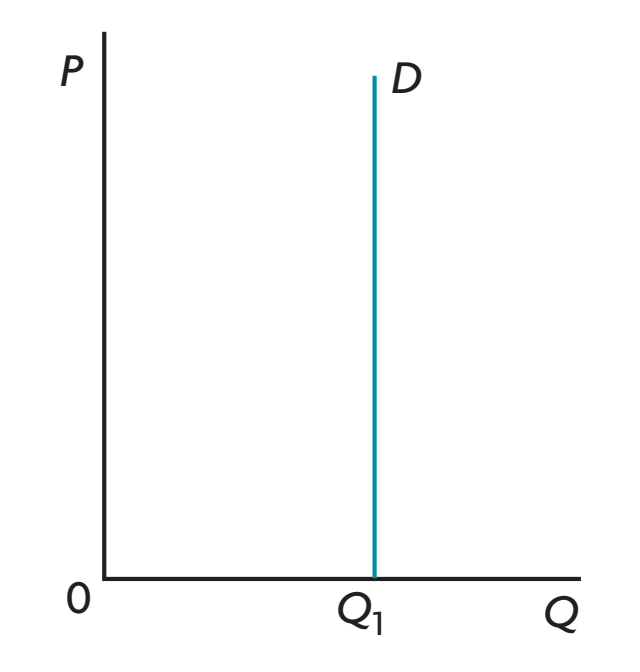
Diagram Explanations:
-
The good is considered essential with no close substitutes -> consumers must purchase the same quantity regardless of price
-
Whether price increases/decreases -> quantity
demanded remains unchanged -> percentage change in quantity demanded = 0% -> therefore, PED = 0
Pefectly elastic demand: PED = ∞
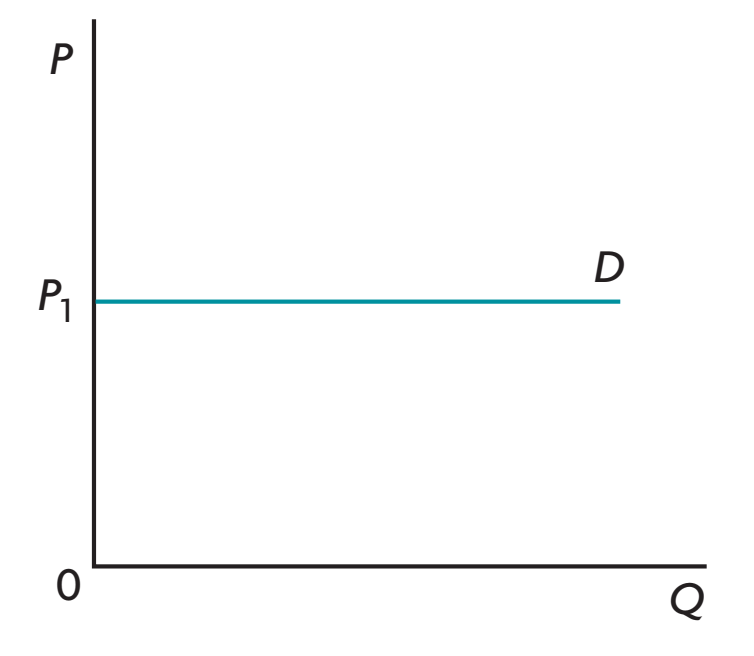
Diagram Explanations:
-
A good has many close substitutes -> when price increases -> consumers could switch to alternatives -> quantity demanded of this good falls from some to 0 -> a small percentage change in price causes an infinitely large percentage change in quantity demanded -> therefore, PED = ∞