Market Equilibrium
Press for different diagrams
Competitive Market Equilibrium

Diagram Explanations:
-
When demand = supply -> quantity demanded equals to quantity supplied (Qd = Qs) -> no shortages or surplus -> market clears -> resulting market equilibrium with equilibrium price Pe and equilibrium quantity Qe
-
When demand > supply -> quantity demanded exceeds quantity supplied (Qd > Qs) -> shortage occurs
-
When demand < supply -> quantity supplied exceeds quantity demanded (Qs > Qd) -> surplus occurs
Changes in Demand & the New Equilibrium Price and Quantity

Increase in Demand:
Diagram Explanations:
-
Initially, the mkt equilibrium is at point a where D1 intersects S, resulting in equilibrium price and quantity P1 and Q1
-
Consider a change in determinants causes a leftward shift of the demand curve from D1 to D2 → at original price P1, movement from point a to point b
-
Point b represents disequilibrium as quantity demanded exceeds quantity supplied → shortage created → exerts upward pressure on price
-
Therefore, price increases from P1 to P2 → a higher price signals consumers & producers that market condition has changed → signals consumers that goods are less affordable & producers that production is more profitable now → incentivizes consumers to buy less & producers to produce more
-
As a result, less quantity demanded → point b moves to point c as excess demand is removed → new equilibrium reached
-
New equilibrium point c with equilibrium price and quantity P2 and Q2

Decrease in Demand:
Diagram Explanations:
-
Initially, the mkt equilibrium is at point a where D1 intersects S, resulting in equilibrium price and quantity P1 and Q1
-
Consider a change in determinants causes a leftward shift of the demand curve from D1 to D3 → at original price P1, movement from point a to point b
-
Point b represents disequilibrium as quantity supplied exceeds quantity demanded → surplus created → exerts downward pressure on price
-
Therefore, price decreases from P1 to P3 → a lower price signals consumers & producers that market condition has changed → signals consumers that goods are more affordable & producers that production is less profitable now → incentivizes consumers to buy more & producers to produce less
-
As a result, less quantity supplied → point b moves to point c as excess supply is removed → new equilibrium reached
-
New equilibrium point c with equilibrium price and quantity P3 and Q3
Changes in Supply & the New Equilibrium Price and Quantity

Increase in Supply:
Diagram Explanations:
-
Initially, the mkt equilibrium is at point a where S1 intersects D, resulting in equilibrium price and quantity P1 and Q1
-
Consider a change in determinants causes a rightward shift of the supply curve from S1 to S2 → at original price P1, movement from point a to point b
-
Point b represents disequilibrium as quantity supplied exceeds quantity demanded → surplus created → exerts downward pressure on price
-
Therefore, price decreases from P1 to P2 → a lower price signals consumers & producers that market condition has changed → signals consumers that goods are more affordable & producers that production is less profitable now → incentivizes consumers to buy more & producers to produce less
-
As a result, less quantity supplied → point b moves to point c as excess supply is removed → new equilibrium reached
-
New equilibrium point c with equilibrium price and quantity P2 and Q2
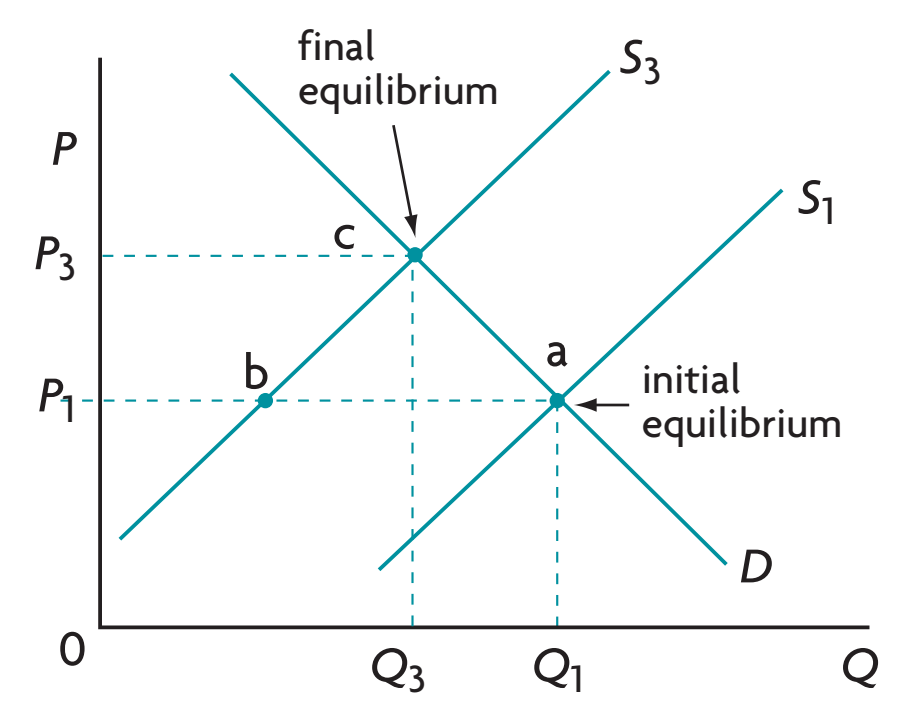
Decrease in Supply:
Diagram Explanations:
-
Initially, the mkt equilibrium is at point a where S1 intersects D, resulting in equilibrium price and quantity P1 and Q1
-
Consider a change in determinants causes a leftward shift of the supply curve from S1 to S3 → at original price P1, movement from point a to point b
-
Point b represents disequilibrium as quantity demanded exceeds quantity supplied → shortage created → exerts upward pressure on price
-
Therefore, price increases from P1 to P3 → a higher price signals consumers & producers that market condition has changed → signals consumers that goods are less affordable & producers that production is more profitable now → incentivizes consumers to buy les & producers to produce more
-
As a result, more quantity supplied → point b moves to point c as excess demand is removed → new equilibrium reached
-
New equilibrium point c with equilibrium price and quantity P3 and Q3
Price as a Signal & Incentive

Diagram Explanation: