Demand curve of monopolistic competition

-
Monopolistic competition = many firms, differentiated products, low barriers of entry
-
Firm sells differentiated products -> consumers perceive the product as different from competitors -> firm has some mkt power -> raise price without losing all customers -> but some close substitutes still exists -> raising prices causes some customers to switch to rival firms -> quantity demanded falls
-
However, lowering price -> attracts customers from competitors -> quantity demanded increases -> the firm's demand curve (AR) is downward sloping & relatively elastic -> bc to sell one more unit firm must lower its price
-
*Key note*: The monopoly demand curve is more inelastic than the monopolistic competition demand curve because in monopoly's do not have close substitutes
Diagram Explanation:
Short-run equilibrium positions of the firm in monopolistic competition
Abnormal profit

-
Product differentiation -> firm has some mkt power -> firms faces downward sloping demand curve (AR) -> firm chooses the profit maximizing output where MR=MC at Qe -> the firm charges the highest price consumers are willing to pay for which is found on the demand curve -> at Qe, the price is Pe -> at Qe the AR (price) > AC -> so total revenue (AR × Q) > total cost (AC × Q)
-
The shaded area = abnormal profits earned by firm
Diagram Explanation:

Normal profit
Diagram Explanation:
-
Product differentiation -> firm has some market power -> firm faces a downward-sloping demand curve (AR) -> the firm chooses the profit maximizing output where MR = MC, determining Qe -> the firm charges the highest price consumers are willing to pay for which is found on the demand curve -> at Qe, the price is Pe -> at Qe the AR (Price) = AC -> therefore total revenue (AR × Q) = total cost AC × Q)
-
The firm earns normal profit/zero economic profit
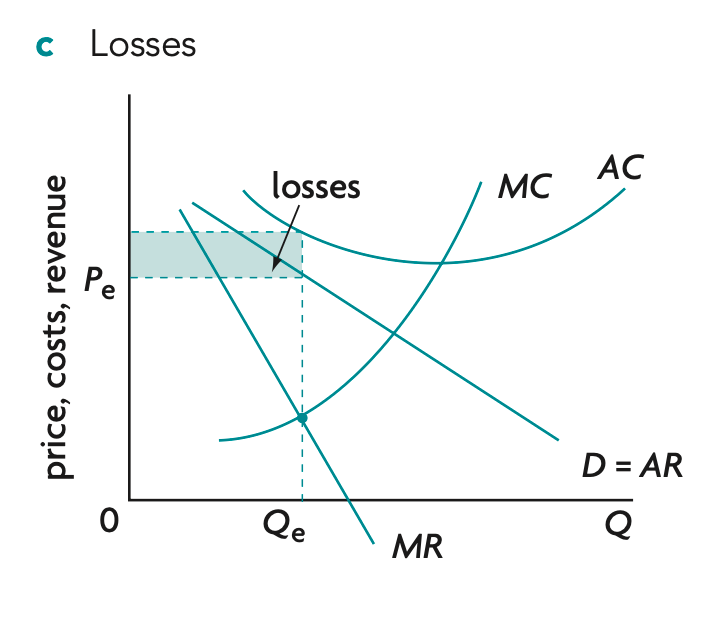
Loss
-
Product differentiation -> firm has some market power -> firm faces a downward-sloping demand curve (AR) -> the firm chooses the profit maximizing output where MR = MC, determining Qe -> the firm charges the highest price consumers are willing to pay for which is found on the demand curve -> at Qe, the price is Pe -> at Qe the AR (Price) < AC -> therefore total revenue (AR × Q) < total cost AC × Q)
-
The firm lose revenue/profit
Diagram Explanation:
LR equilibrium of the firm in monopolistic competition

-
Firms initially earns abnormal profits -> attracts new firms into the mkt as there's no barriers of entry -> number of firms increases -> consumers have more close substitutes -> each firm's demand becomes more elastic -> price & revenue decreases -> entry continues until price = ATC -> firms only earns normal profit -> firms maximizes profit where MR=MC -> demand curve is tangent to ATC curve -> no incentives for further entry or exit -> long run equilibrium achieved
Diagram Explanation:
Profit maximization by a price-fixing cartel
Diagram Explanation:

-
Cartel = a group of independent market participants who collaborate with each other & avoid competing with each other in order to improve their profits and dominate the market
-
Firms collude to form a cartel -> they act as a single monopolist -> cartel faces the market demand curve, with MR below AR -> cartel maximizes profit where MR = MC -> determines the output Qπ -> cartel charges the highest price consumers are willing to pay for Qπ, found on the demand curve (Pe) -> Pe>AC -> TR>TC -> cartel earns abnormal profit
-
As a result, output is lower and price is higher than under competition -> consumer surplus falls, producer surplus rises, and deadweight welfare loss occurs due to allocative inefficiency