Negative Externalities & Interventions
Press for different diagrams
Negative Production Externality

-
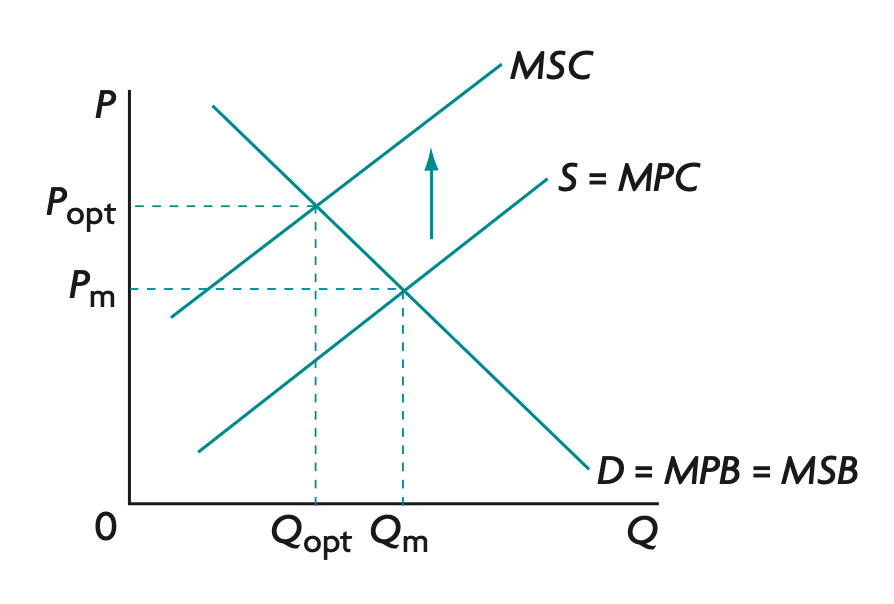
Initially, the market is at equilibrium where MPC intersect with MPB, with equilibrium price and quantity Pm and Qm -> producers only consider private costs from producing the g&s and ignores the external costs -> MSC > MPC because production creates external cost -> creates divergence btw MSC and MPC
-
Creating new equilibrium at MSC and MSB intersection with equilibrium price and quantity Popt and Qopt -> Qm > Qopt -> showing overallocation of resources of the production of g&s -> market failure -> allocative inefficiency creating DWL of area e
Diagram Explanation:

Imposing an Indirect Tax on Output/Pollutants
-
The gov corrects this mkt failure by imposing an indirect (Pigouvian) tax equal to the external cost per unit of output -> supply curve shifts vertically upward from MPC to MSC, since producers now face the full social cost of production (MSC = MPC + tax) -> new equilibrium occurs where the MSC curve intersects the demand curve, resulting in the socially optimal quantity (Qopt) and the optimal consumer price (Pc = Popt) & output decreases from Qm to Qopt, reducing the overproduction caused by the negative externality.
Diagram Explanation:
Tradable Permits

Diagram Explanation:
-
The gov corrects this mkt failure by setting a fixed number of tradable permits (Q1) to cap total pollution -> the supply of permits is perfectly inelastic -> economic growth or increased production raises firms' demand for permits -> shifts demand curve from D1 to D2 -> because the supply of permits cannot increase, firms compete for the limited permits -> the mkt price of permits increases from P1 to P2, while the quantity of permits remains Q1 -> the higher permit price increases firms' production costs, encouraging them to reduce emissions or adopt cleaner technologies
Government Regulations
-
The gov corrects this mkt failure by setting environmental regulations -> firms are legally required to reduce pollution or face high costs -> firms install pollution-control equipment or adopt cleaner production methods -> production costs increase -> supply decreases MPC shifts leftward towards socially optimal level -> output falls from Qm toward Qopt -> pollution decreases -> external costs fall -> allocative efficiency improves -> welfare loss decreases
Diagram Explanation:
Negative Consumption Externality

Diagram Explanation:
-
Initially, the market is at equilibrium where MPC intersect with MPB, with equilibrium price and quantity Pm and Qm -> consumers only consider private benefits from producing the g&s and ignores the external costs -> MSB < MPB because consumption creates external cost -> creates divergence btw MSB and MPB
-
Creating new equilibrium at MSC and MSB intersection with equilibrium price and quantity Popt and Qopt -> Qm > Qopt -> showing overallocation of resources of the consumption of g&s
-> market failure -> allocative inefficiency creating DWL of area e
Market-based: Indirect Tax

-
The gov corrects this mkt failure by imposing an indirect tax equal to the external cost per unit of consumption -> the tax increases the price consumers must pay -> shifting the supply curve vertically upward by the amount of the tax from S = MPC = MSC to MPC + tax -> therefore consumers pay higher at Pc & producers receives lower revenue at Pp -> new equilibrium occurs where the tax-adjusted supply curve intersects the demand curve (MPB), reducing consumption from Qm to the socially optimal quantity (Qopt)
Diagram Explanation:
Government Regulations & Advertising

-
The gov corrects this mkt failure by setting gov regulations & advertisements -> the gov provides information about the harmful effects of the good through advertising campaigns -> consumers become better informed and aware about the external costs of consumption -> consumers perceive a lower private benefit from consuming the good -> MPB decreases -> demand shifts left toward MSB from D1 to D2 -> quantity consumed falls toward the socially optimal level -> negative externalities and welfare loss decrease
Diagram Explanation: