Positive Externalities & Interventions
Press for different diagrams
Positive Production Externality
-
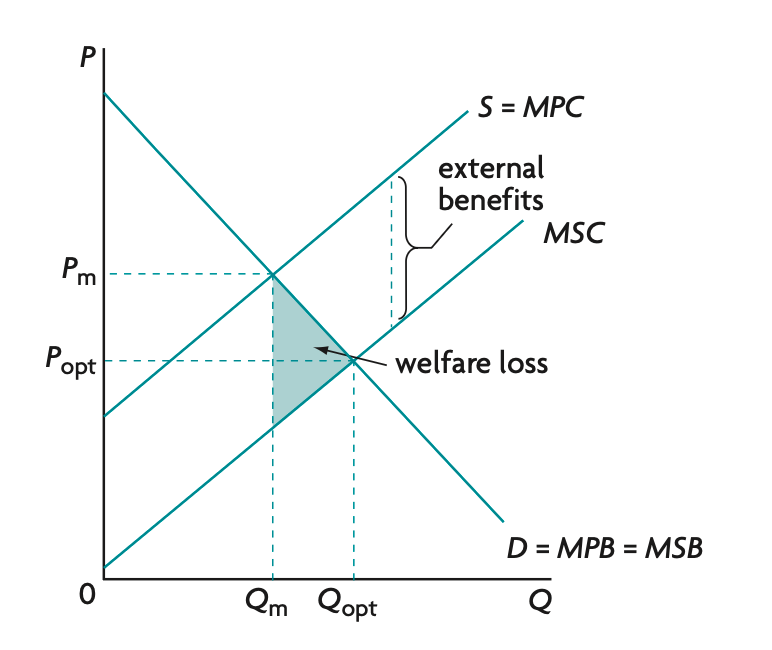
Initially, the market is in equilibrium where the demand curve (D = MPB = MSB) intersects the supply curve (S = MPC), resulting in a market equilibrium price of Pm and quantity Qm
-
However, the production of the good generates positive externalities, creating benefits for third parties that producers do not receive compensation for -> therefore, the marginal social cost (MSC) is lower than the marginal private cost (MPC) because producers only consider the private benefits & ignores external benefits created for society -> MPC > MSC -> creates divergence btw MPC and MSC
- Creating new equilibrium at MSC and MSB intersection with equilibrium price and quantity Popt and Qopt -> Qm < Qopt -> showing underallocation of resources of the production of g&s -> market failure -> allocative inefficiency creating DWL of shaded area
Diagram Explanation:
Direct government provision
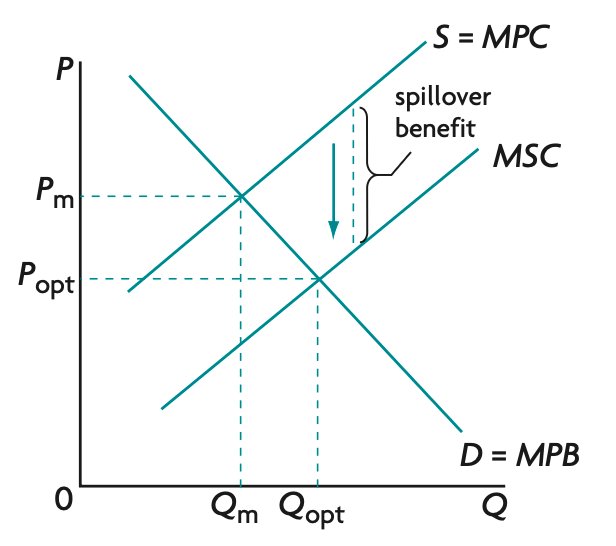
Diagram Explanation:
-
The gov corrects this mkt failure by providing the good or service directly -> the gov produces or finances the production of the good, increasing its availability -> MPC shifts rightward to MSC as more quantity supplied -> output increases from Qm toward the socially optimal quantity Qopt -> more people benefit from the positive externalities generated by production -> the external benefits received by society increase -> the underallocation of resources is reduced -> allocative efficiency improves -> welfare loss decreases
Granting a Subsidy

Diagram Explanation:
-
The gov corrects this mkt failure by granting a subsidy -> the gov subsidize production -> cost of production for firms lowers -> therefore, firms willing to supply more -> quantity supplied & shifts MPC rightward to MSC -> output increases from Qm toward the socially optimal quantity Qopt -> more people benefit from the positive externalities generated by production -> the external benefits received by society increase -> the underallocation of resources is reduced -> allocative efficiency improves -> welfare loss decreases
Positive Consumption Externality
-
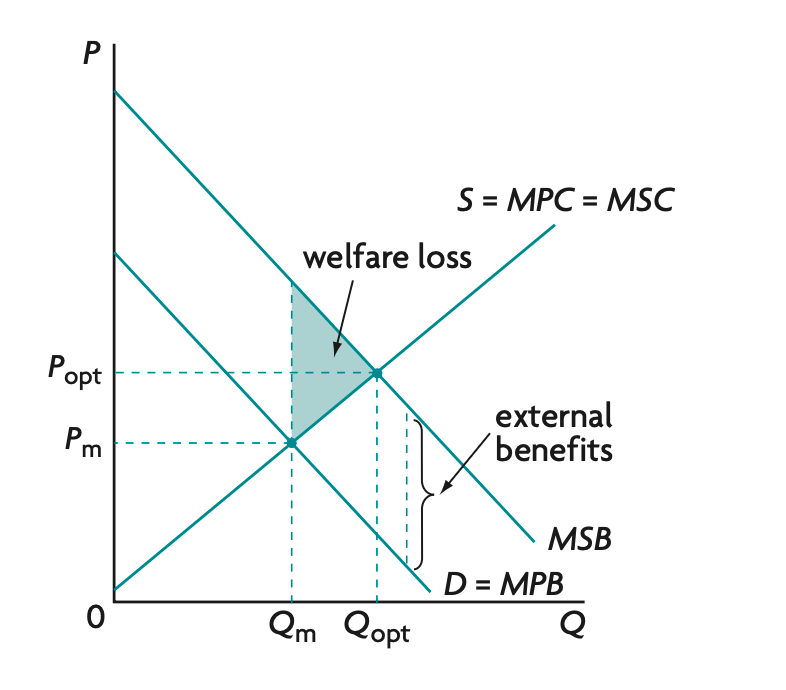
Initially, the market is in equilibrium where the demand curve (MPB) intersects the supply curve (S = MPC = MSC), resulting in a market equilibrium price of Pm and quantity Qm
-
However, the consumption of the good generates positive externalities, creating benefits for third parties that producers do not receive compensation for -> therefore, the marginal private benefit (MPB) is lower than the marginal social benefit (MPC) because consumers only consider the private benefits & ignores external benefits created for society -> MSB > MPB -> creates divergence btw MSB and MPB
- Creating new equilibrium at MSC and MSB intersection with equilibrium price and quantity Popt and Qopt -> Qm < Qopt -> showing underallocation of resources of the consumption of g&s -> market failure -> allocative inefficiency creating DWL of shaded area
Diagram Explanation:
Legislation or Advertising

Diagram Explanation:
-
The gov corrects this mkt failure by legislation/advertising -> the gov provides information about the benefits of the good if consumed -> consumers are better informed about the benefits -> willing to buy more -> quantity demanded increases -> shifts D1 rightward to D2 -> Qm expands towards socially optimal level Qopt -> allocative efficiency -> welfare loss decrease
Direct Government Provision

Diagram Explanation:
-
The gov corrects this mkt failure by providing g&s directly -> the gov produces/finances the production of the good -> supply curve shifts to the right from MPC to S+gov provision -> price falls from Pm to Pc -> good becomes more affordable -> quantity demanded increases -> Qm expands to Qopt -> more units generates external benefits -> underallocation of resources is reduced -> allocative efficiency improves -> less welfare loss

Granting a Subsidy
Diagram Explanation:
-
The gov corrects this mkt failure by granting a subsidy -> the gov subsidize production -> cost of production for firms lowers -> therefore, firms willing to supply more -> quantity supplied increases & shifts MPC rightward to MPC - subsidy -> lower price from Pm to Pc -> more people can afford the good -> quantity demanded increases -> Qm moves towards Qopt -> the external benefits received by society increase -> the underallocation of resources is reduced -> allocative efficiency improves -> welfare loss decreases